Showing posts with label Solar. Show all posts

Tuesday, December 3, 2013

A year and a bit on Solar Panels - Last post perhaps??

During these long winter days, with little to do  (err, ok - there is a LOT to do, but at times I find little motivation) I at times over-nerd, and just become all giddy over data.   Well, today I am posting yet another graph documenting our Solar panel output.  And this time we have a complete year in it, plus much of the core cruising months of another year:


Our two 245w panels delivered an average of 135Ah/day over the period of April 1st to September 30th.  And as you can see, from May through August we mostly pulled in over 150Ah/day.

The TriStar also reports out Wh/day results, and here is the same time period - showing Wh vs. Ah as above:


Same as above, but plotting reported Wh/day output

So there you go.  Data.

Note I also plotted the 'modeled' or predicted line on the Ah chart.  I am very happy with how close the actual performance tracked to what was predicted, as before laying out the $$ for our solar panels, I really wanted to get an idea what I could expect.  Unfortunately, asking fellow boaters did not really give useful information.  "All I need", "Charged my batteries by 10:30am", and other non-specific responses really do not help.   But for me, I can now answer "Around 135Ah/day average from May through September.  Over 150Ah/day during the peak of the summer".  And with the good modeling tools out there, you can rather accurately predict output for your situation.

This might be one of my last Solar postings, as I am not sure there really is much more that can be said.  I will continue to include Solar output in our monthly 'Costs' posts, but other than that - am about done in terms of being able to give additional value with further posts.  If you have stumbled across this and want to see more about our experience and system, here are a few links:

See All posts tagged with Solar:  http://mvvikingstar.blogspot.com/search/label/Solar
Some details about our installation:  mvVikingStar.blogspot.com/..../we-have-solar
Model / predict YOUR solar output: mvVikingStar.blogspot.com/..../solar-panels-on-boat-modeling


Solar on a boat?  As mentioned in some prior postings, our usage greatly influences our outcome; mainly that we are away from the dock 8+ months out of a year and hence produce 100% of our own electricity - which is very expensive.  For us, we continue to be very happy with our investments.  They are well on track to cross the ROI point some time next year, and until then we enjoy the oh-so-quiet hours of reduced generator run time they provide. 

In closing, a few quick thoughts on purchasing Solar panels for a boat:
The Twins on Viking Star
  • Best value in terms of $/watt will be the LARGE panels used on houses - hopefully you can fit them.
  • Shipping of panels can be very expensive, try looking at a local installer and see if they will add you on to a larger shipment they are making.
  • Use an MPPT controller, they are well worth the extra $
  • There is some value in installing a separate MPPT controller on each panel, esp with regards to shading.  Depending on controller costs you might look into this.
  • Look into Solar credits or tax savings, both at the Fed level and the local state level.  Many times Boats will qualify for these.

OK, I do hope this series of posts are helpful to someone considering Solar on their boat.  Feel free to contact me if  have any specific questions, and I will try to answer best as I can.


Thursday, October 31, 2013

Yearly energy usage for a full time cruising boat - Viking Stars Energy report for the past 12 months.

It seems I get energetic in October.  Today I was updating the cost spreadsheet, plugging in readings from the Hour meters and started wondering - Hum.  How much energy did we use this last year?  Well, looking over Viking Stars blog I have asked this question a cople of times before:

For the 12 months ending Oct 2012: mvVikingStar.blogspot.com/../update-to-viking-stars-energy-use-per
12 months ending Jan of 2011:  mvVikingStar.blogspot.com/../viking-star-average-energy-usage


OK, so I have not been that consistent, nor fixed with October.  But who knows, maybe with two in a row a trend is starting!


How much energy do we use in a year?

Lets review.  Kristi and I use energy, just like most any person in the world does.  But as we live in a very small house and do not have a car, we use noticeably less energy than the average American.  We are full time cruisers and spend from the end of February to the beginning of November 'Out There'.  During those 8+ or so months we are fully dependent upon ourselves for energy production as well as, depending on how 'Far Out' we get, water production. During the core of the winter months we tend to come in and rent a transient slip, to get easy access to coffee shops and less-muddy trails.

Our source for Energy is primarily Diesel fuel, with a little Propane and Gasoline thrown in. And with that we move ourselves, heat our space and water, cook our food, generate our electricity, even make our drinking water as needed.  And for the last couple of years we have supplement our electrical needs with two Solar panels (mvVikingStar.blogspot.com/search/label/Solar)    When in port we try to use the shore power cord as much as possible because, truth be told, shore based energy is dramatically less expensive then on-board generation.

Over the past 12 months energy consumption on Viking Star has been:
  • 500 Gallons (320g for the Mains, 50 in the Gen/WM, and 120 for the Hurricane heater, maybe 10 more for the Dickenson)
  •  8 Gallons of Gasoline for the dinghy outboard motor
  • 15 Gallons of Propane for the stove and BBQ
  • 4,900KWh of Electricity while in port.


Running these all through conversions into a common energy measurement ( BTUs ) the above comes to 88 Million BTUs for the two of us.  A massive reduction from the prior years 116 MBTUs, continuing the downward trend from 140 MBTUs the year before that.  What changed?   Biggest change is how we heat during the Winter.  Up until last winter we had heated primarily with the Dickinson Diesel stove, a heater we still love for its warm dry heat.  But it is NOT the most efficient, only because it tends to be an all-or-nothing heater.  These days we rely on the Hurricane hydronic heater to warm the boat up in the morning, and let the electric space heaters take over and carry us throughout the day and into the evening.  That is perhaps the biggest change.  Solar helped some as well (See below)

As with prior years energy use of rental car / bus usage was not tracked; if we add say an extra 50 gallons of gas for the rental cars and buses we use, that adds another 6-7 MBUTs.   Lets 'Round up' our yearly energy usage to 95 MBUTs for the two of us, or a little under 50 MBTUs each in direct energy consumption.  


How does this stack up?

Going to be lazy here and just assume the average energy consumption per person has not changed that much from last year to this.  Hence am reusing last years 'chart'.  Converting the US Average of 98,418KWhs of energy consumption per person into BTUs we still get 336 MBTUs per-person.

336 MBTUs vs. 50 MBTUs.   Yes, living the Small Life on Viking Star we use less then 1/6th the amount of energy an average US citizen does.  


One Sixth...

In fact, we even use less energy than the average world-wide citizen does (at 72 MBTUs).

Living the Small Life on a Boat can be very very energy efficient, even if it is a 50 year old boat..


How much does it cost?

Doing a rough translation of the fuel used above (ala, using $4/gal for Diesel, etc.)  I come to a yearly cost of around $2,500.  Add in a couple hundred for Rental Car fuel, and we are at  a yearly energy cost of around $2,700  .

Which points out a big truth about Energy on boats:  We may use little, but what we use costs a LOT.  Hence the real strong focus on energy savings, LED lighting, efficent refridguration, Solar / Wind generation.

So, how does this compare to the direct energy costs you see in a year?  Electricity, Oil, Natural gas, Auto Gasoline, etc...


A note on the Solar Panels ROI

I added up the number of AHs produced over the past 12 months and it came to around 31,500Ahs of electricity produced.  This translates into over 260 hours of time we did NOT need to run the generator.  To date we have offset almost 45% of the cost of the solar installation by not running the generator, well on the way to achieving ROI in 3-4 years.


Energy.   As a cruising boat we know we use a lot more than others.  Between space heating, movement, computers, refrigerator and freezer, we are kind of an energy pig.   But I think looking at the lifestyle, it is clear we are comparatively but a wee-little one.


Friday, June 14, 2013

A Year with Solar, or is it: “Wait until he figures out what a monumental waste of money that was”. . . . .

Less than a month after installing our two large Solar Panels on Viking Star I overhead a passerby make the above statement to his companion.  I did reply to him that he was a bit presumptive with his judgment and that modeling indicated they would have a ROI of less than 5 years.  I can tell you he just discounted me as one of those ‘fantasy’ types.  Well, here we are – a bit over 1 year on this system and I think it would be good to look back and see how well they actually worked.   Was installing Solar a great idea, or as so elegantly put a ‘monumental waste of money’?

Before deciding to place the panels aboard, one of the greatest difficulties I had was getting actual DATA from folks on how their panels performed.  I got things from ‘All We need’ to ‘Great’, to ‘Fills my batteries by 11am’.  (Monumental guy did not have any panels, so I am not considering his input).  But without exception:  all the ‘observations’ were gut feelings.  No real data.

Being a (at one time, before crossing to the dark world of Marketing) Engineer – this just would not do.  So I set out to model the panels, you can read more about that here:
           mvvikingstar.blogspot.com/2012/10/solar-panels-on-boat-modeling-and.html

To get actual data - the charge controller I purchased has data logging capabilities.   But before we get much further, let’s make sure some ground rules are established:

  • We cruise in the Pacific Northwest- if you are somewhere else, likely your results will be different.  (See the Modeling post to learn more).
  • Our  ‘Cruising’ season is March through the end of October.  During this time we are very rarely in port, and even more rarely have access to low cost shore power.  

That last point is a critical one, as it means -- almost without exception -- every AH we consume we need to make on the boat.  Either via the large 270A  Leece Neville alternator attached to our main engine, or via the Kubota Dc generator -  OR  via the Solar Panels.  And this, to be fair, is huge.  It is VERY EXPENSIVE to generate electricity on a boat.  I estimate it costs $1.14 / 100Ah running the DC Generator – direct costs only (Oil and Fuel).  That does NOT include any amortization for the original cost of the Generator, or depreciation for its replacement.  Every 100Ah costs over a buck….   And with us away from the dock so long, costs add up very quickly!


OK, on to the results.  Here is a graph of the actual daily AH log as provided from the Solar Regulator.  The thin purple line is the actual daily results – you can see cloudy days and sunny ones.  The black line is a 15 day rolling average - to try and smooth things out a little.  Finally, the thick blue line is what the modeler predicted our output would be.


1 year actual results
(Click on image for a larger version)
You can see the modeler did a rather good job of predicting.  In fact, over the year the Actuals were 2% greater than the Modeler predicted.  Looking behind the scenes in more detail:  Over our cruising season (March through the end of October) we produced an average of 124.7Ah/day.  We saved 245 hours of run-time on the generator and that results in a raw ROI of 5.5 years.   Figuring in the Federal Tax Credit, it drops to 3.9 years.

So, for a boat cruising in the rainy Pacific Northwest, the Solar Panels have a ROI of under 4 years.  And best of all?   I do not need to listen to the Generator during most of the time as a result!   In fact, we are back into the time of year where we likely will not need to use the Generator at all until the end of September.  And then only when we do Laundry.

(To see all our posts on the Solar Panels, click here:  http://mvvikingstar.blogspot.com/search/label/Solar )

Saturday, October 20, 2012

Solar Panels on the Boat - Modeling and Performance


One of the challenges I had while deciding about installing solar panels on Viking Star was getting an idea of what to expect.  Asking around got a WIDE range of answers, from: “All I need”, to “Charges the batteries by 11am!”, to “Will not work at all in the rainy PNW”, to even “What a monumental waste of money solar is”.   Needless to say - no consensus.  More troubling was, without exception, none of the "inputs" were based on  ACTUAL data.   Even those who claimed ‘All I need’ were not able to tell me what their needs were – rendering their input useless to me.

I just could not go down a path blind.  I needed SOME idea on what to expect.  And so the old engineer in me emerged.  Solar system output is really a factor of four things:

  1. Expected solar radiation from the sun  (time of year, location, and cloud cover)
  2. Size and efficiency of panels and system
  3. Orientation of panels relative to the Sun
  4. Placement of the panels relative to obstructions (shading)


(BTW, the following is the Long Path I took.  To see a shortcut, skip to the end of this blog post!)

Solar Radiation:  I located a local shore-based installation who had been tracking their results and who would send me their actual energy produced data.  Using this I was able to extract the solar radiation per month in this location covering not only seasonal variations (Summer vs.Winter), but also average cloud cover over a year period.

Size and Efficiency of panels and System:  This is easy.  Viking Star has two 240w panels  so a 480w system.  Completing the system is the MPPT controller I selected which has a conversion efficiency of 95%. Need to throw in some additional losses for the wiring voltage drop.

Orientation relative to the Sun:  Here is a point where installations on a boat differ greatly from shore-based ones.  While most shore installations are pointed due south and tilted towards the Sun (often at a compromise angle between peak output for summer vs. winter) panels of a boat are often placed flat.  (or some very small angle). Mounting flat is easiest.  While using a more complex mounting system and being able to point the panels towards the Sun can give significant output gains  – it also requires adjustments throughout the day as the Sun moves and as the boat swings around anchor.  (Shore-based installations do not need to deal with this swinging - hence they often just use fixed tilt mounts pointing due south)  I chose to mount Viking Star’s panels flat for two reasons: The panels are rather large - a tiltable mounting system would have to be very robust to securely handle them.  Plus I am just lazy.  I do not see myself climbing out several times a day ‘repositioning’ the panels as we swing around the anchor…

How much do we lose by mounting flat?  That depends on the time of year, as well as the latitude of the boat.   The actual formula is:

   Loss% = 1 - SIN(90 – Latitude + Solar Declination + Panel Tilt)  

(Yes, those Celestial navigation skills come into play!).   Putting this all together we get  for 48 North:

Sun Declination (Degrees)
Solar Elevation Angle (at 48N)
Loss due to 
Flat Panels
Jan
-22
20
66%
Feb
-13
29
52%
Mar
  -3
39
37%
Apr
 10
52
21%
May
 18
60
13%
Jun
 23
65
9%
Jul
 21
63
11%
Aug
 14
56
17%
Sep
   3
45
29%
Oct
  -8
34
44%
Nov
-18
24
59%
Dec
-23
19
67%


During peak cruising months (April – September) the loss is relatively small  – 10-20%.  But this quickly increases as we get into winter where 60-70% of the potential output is ’lost’ due to mounting the panels flat. Combined with the much shorter days means during the winter we can expect little output from the solar system. Happily those are also the months we tend to be in port with shore power readily available.


Combining this loss table with the observed Solar Radiation derived from the shore based installation's production data,  I came up with the following modeled output for our system:

Ah/Day
(480w system)
Normalized (100W system)
Jan
11
2
Feb
38
8
Mar
66
14
Apr
110
23
May
149
31
Jun
153
32
Jul
161
33
Aug
142
30
Sep
99
21
Oct
50
10
Nov
17
4
Dec
16
3


And here you can see the actual results so far:


We have been tracking ahead of the predicted performance, but then this summer was one for the records books (literally).  Side note:  Those BIG dips to 50 or below the 1st month are the result of not attaching the remote voltage sensor to the MPPT controller.  See more here: http://mvvikingstar.blogspot.com/2012/06/controller-alternator-interaction.html


An easier way (the Shortcut)

If you too want to model output of solar panels you can follow the steps above (and I can send you .xls files with all the formulas, though you will need to locate someone near your cruising grounds that has reliable data from which you can start the assessment).   OR, you can just go to this site (which of course I found AFTER going through all the above - and I do wish they would stop changing the URL!!!):
         http://pvwatts.nrel.gov/index.php

It not only has a large database of solar radiation throughout the world, but will also do the tilt (orientation) adjustments for you!  Start by entering approximately where you want to model.  Then on the the map click the specific solar data location you are interested in.  Click on the "Go To System Information" arrow on the right hand side and you can enter your system size as well as tilt angle.  A few notes:

  • PVWatts will not work for systems under 1,000w in size.  A workaround for this is to multiply your expected system size by 10 and enter that .  For example: Viking Star’s 480w system is entered as 4.8 kW (4,800 watts)  in the program.  
  • Leave Module Type: at Standard
  • And Array Type: at Fixed.
  • System Losses (%):  Leave it at the default 14%, or click on the details if you want to get a little more refined.
  • Set Tilt and Azimuth =  0 if the panels are flat or leave it with the default values for a good approximation if you plan to tilt the panels. You can get better results by changing the mounting to 1-axis or 2-axis tracking (depending on your mounting system - and desire to reposition things throughout the day), but I did not play with those.
  • Press the "Go To PVWatts Results" button on the right to get predicted results throughout the year.
  • Looking at the AC Energy (kWh) column, divide these numbers by 4 to back out the 10x we did in step one and make a rough conversion into Ah per day. (for a 12v system.  If you have a 24v system, divide by 8 for a ruff idea of 24v AH's)


  • This web page predicts 162Ah / day expected output from Viking Star's system in June.  A bit more than the 153Ah I modeled, but our actuals aboard Viking Star seem to be running ahead of modeled results.

    The final issue is shading.  Here you need to get creative and try to minimize it.  The MPPT controller, combined with built-in bypass diodes in the panels will help a LOT with shading, but still shading will reduce output dramatically   During the peak summer months I noticed about a 30Ah reduction per day if we were docked pointing North as opposed to South, this I expect was due to the shadow from our mast when docked pointing north.  Just one more ‘consideration’ when pulling into dock now. . .

    BTW:  There is a good argument for using a separate a MPPT controller for each panel installed on a boat, to help work around this partial shading situation.  Given that MPPT controllers are becoming more and more common, and the prices are dropping, doing so would be a good consideration for future installations.  But if you do use a single controller, like on Viking Star, make sure to wire the panels in SERIES to maximize output during partially shaded conditions.  And note this is a dramatic departure from what was recommended a few years ago (Parallel).  It is due to both the usage of the MPPT controller and increased presence of zoning / internal bypass diodes on modern large panels.  If connected parallel - a shaded panel will drop out entry  while if a modern panel is connected in series the partly shaded panel will lose the shaded segments, but the unshaded segments will continue to contribute (due to internal panel zoning and by-pass diodes).

    Overall we are happy with the system.  It accomplished it's key goal: reduction of generator time.  It is only this last month we needed to start using the Generator, and that was just for covering the drying cycle during laundry.  Though as expected -  as we are heading into the latter part of October we are finding we need to put time on the generator, varying from day to day.


Sunday, June 24, 2012

Controller / Alternator interaction SOLVED


Well, today I solved the funny ‘interaction’ issue between the TriStar MPPT controller and the mains alternator.  IDing the True Cause was made so simply once I dumped real-time data from the controller using a connected computer.  Most people who had commented back about this got it right, sort of. . . . Though  it was the controller going into Float Mode due to high charge voltage, what had bothered me was this reduced output would occur even when the batteries were down in charge (Vbat at say 14.3 while under heavy charging - receiving 195A from the mains alternator) –  I expected ALL sources to be in ‘bulk’ mode as we had not reached the terminal charge voltage of 14.6v (per Dyno-battery specifications for out house battery)


The issue was I had not wired up a remote Voltage Sense to the Morningstar controller – as that would require a not-so-simple pulling of yet-another-wire from the front of the boat to the back.   And even though I am using mcm373 cable for battery runs (mcm373 is two sizes larger then 4/0 wire);  195A from the mains alternator results in a almost 0.6v drop.   This was reflected back to the Morningstar causing it to see a higher assumed 'battery' voltage, cutting back back on delivered amps and even entering ‘float’ mode….

Example – while underway today I measured:
Vbat = 14.34v – per DMM (Link-10 shows 14.30v)
Valt  = 14.85v – Per DMM.
Aalt  =  195a  – Per clamp-on DMM.
Vmsc = 14.80v -  Per Morningstar internal reporting.

Morning Star had entered Float mode.

Without a remote sense wire the Morningstar can only see the voltage at the ‘common’ distribution point which starts with the actual battery voltage, and then includes the voltage drop over the mcm373 wire as a result of it carrying the heavy mains alternator current.  As opposed seeing only  the actual battery voltage.  (The mains alternator regulator was just fine, it already has a remote battery voltage sensing wire).

Lesions learned:
  1. Even if one uses BFA Wires (Big Fat A__) (mcm-373)- Lots of Amps still can cause a significant voltage drop.
  2. Don’t be a lazy bum, pull the remote sensing wire!!!


Oh well, guess will need to set aside a day to pull a cable.  Just need to decide how I can get it past the back of the washer without having to pull that out…


Saturday, June 23, 2012

Solar Data!!! What does Solar on a Boat Really Produce?


Ahh, love it…

Today Kristi must have been bored, as she kindly rearranged the FHSUs (Forward Horizontal Storage Units  aka V-Berths) clearing access into the starboard cabinet.  As a result I could pull out a Keyspan USB <--> RS-232 adapter and connect up the TriStar MPPT data logging software.  And guess what, they had already configured it from the factory to capture some good stuff!!!

Daily AH produced via 480W of panels
Here is a graph of daily Ah’s produced starting from when we fired up the panels (May 25th being the 1st Full day), and yup you can see those first couple of days were productive ones!  Looking at the data closer I again notice a correlation between very low output days and when we motored, but not symmetrically.  All the ‘really low’ days (100Ahs or less) were days we motored.  However there are also some days we motored where the output did not drop real low..  No real answer for that.   Finally  I would ‘guess’ the days in the 120-160 range were likely rainy days, but I did not mark the calendar so cannot say with certainty.

This is where monthly averages come into play!  And the controller was pre-configured to capture total Ah’s produced from 1st power-on.   4,462 Ah’s were delivered over a 29 day period.  Or an average of 153Ah’s per day.  (A more ‘correct’ measurement is the KWh’s produced, which is 59KWh total, or a bit over 2KW’s per day.  Seeing as Boaters seem to like Ah’s will stick with that for now.)

OK, this is real results for two 240w panels oriented largely ‘flat’ here in the PNW.    How does this compare and what does it mean?  4,462Ah comes to around 45 hours of generator time we did not need.  And in fact, we have only used the generator twice after installing the panels – both times to support Laundry.

My modeling had indicated 61KWh (or 4,583Ah) for the month of June.   Looks like I hit it within 3%.

Side note:  The TriStar has optical isolation on the RS-232 port which is self-powered via the external RS-232 connection (they steal power from DTR and/ or RTS).  I had good results using a Keyspan 19HS adapter, but when I tried another no-name one things would not work.  Not only does there need to be a connection on DTR and/or RTS, but it must be sufficient 'voltage' to power to optical isolation.  Many lower-cost RS-232 dongles may have the signal, but skimp on the voltage - trying to get by with just 5v from the USB connection.  I have always had good luck with the Keyspan 19HS, it is kind of the golden-standard of the industry.

See a bit more here: http://www.morningstarcorp.com/en/support/item.cfm?ItemId=209
     or here:  http://www.morningstarcorp.com/en/support/library/TS.APP.RS232_Wiring.01.EN.pdf


This will be interesting to see how things progresses over the summer.  I will add a ‘Solar Ah produced’ row to the month ‘Costs’ summary.  Keep an eye there!

Tuesday, May 29, 2012

Solar output when the Sun doesn't shine


(And while underway)

Yesterday we left Sucia  under Cloudy Skies.  It gave me a little opportunity to log our new Solar Panels output under conditions that were not a Sunny May Day.  We had two deviations:  1) Cloudy Skies, and 2) an interaction between the Solar controller and the main motor alternator.

Here is a chart that shows in Blue the average out of our panels over the past three full-sun days, while the Red shows a portion of yesterdays output.

From approx 8:00am to 11:00am I logged the production while under Cloudy Skies (it was raining).  The 11:35 data point is while we were underway with the mains alternator putting 150A into the batteries.   Note the dramatically reduced output from the Solar panels, even though over the next hour the skies fully cleared.  At 12:40 we stopped (idled) while awaiting a tug and tow to pass before us in  a  VTS traffic lane and you can see the Solar output popped up to 396w – Right in line with the average for full sun production.  Then when we got underway again Solar output dropped to 27W (about 2 amps) while the mains alternator was putting 101A into the batteries.

This VERY LIMTED sample set indicates two things to me:
1) Solar output is reduced to about 1/2 while under cloudy (rain) skies.
2) There is an interaction between the controller and the mains alternator – with the Solar controller in effect shutting down when we are underway.


Friday, May 25, 2012

Solar results - How is it working?

In short - VERY WELL!

Today was a nice sunny May Day, with little if any clouds.  After the day was done (or, after the Sun got so low there was little output from the Solar Panels) they had covered ALL OUR ELECTRICAL NEEDS FOR THE PAST 24 HOURS!!!

I am impressed.  Yesterday after running the generator, and a little of the panels, we had fully charged batteries. This morning the Link-10 battery monitor reported we had used -82Ah over the night.  As of 5:30pm this evening we had replaced those 82Ah, put in another 44Ah, AND provided all the power consumed during the day!

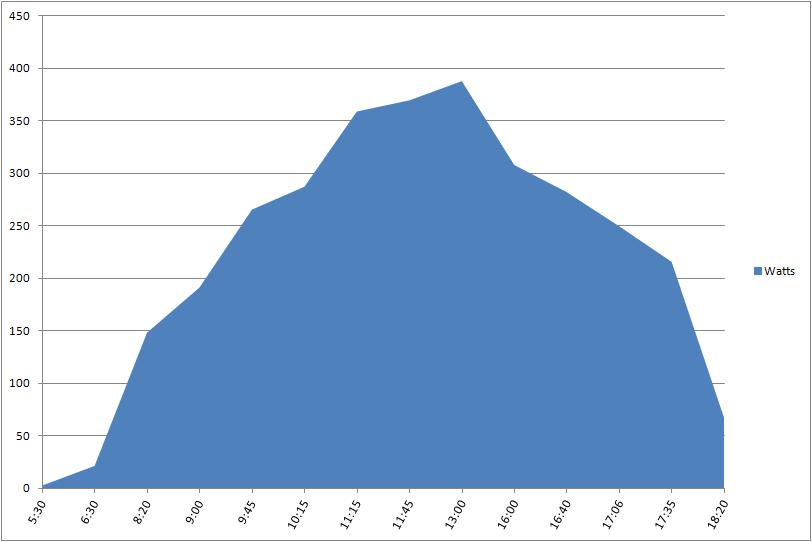
Though I have not been able to connect a computer to the controller and enable the built-in data logging, I did keep records throughout the day using my clamp-on Amp meter.  Here are the results:


We peaked at 388 Watts (or 29.5 Amps at the time), this is from panels rated at 480W of capacity - do remember the panels are laying flat, not directed at the Sun.  Over the day I tried to remember my Calculus, failing that I used the trapezoidal method for calculating the number of Amp / Hours produced from the above curve:  247Ah.

So there you are.  Real Data.  Here in the Pacific Northwest, 480 watts of panels orated largely flat provided 247Ah of power over a nice sunny May Day.  I should add, my predicted output (the one I based ROI's on)  for May is 149Ah - however remember that predicted monthly average would include days 'when the Sun Does Not Shine'.

But on a Nice Sunny May Day, 247Ah is ALL of our Energy needs - Who knows, maybe we should try heating the Water using this abundance of electricity!

I am happy.

UPDATE: May 26th provided 256Ah throughout the day.

UPDATE #2:   May 27th had a high cloud cover (Maybe 10%??) through most of the day.  Still 245Ah were produced.

We will be motoring for the next few days and I will not be able to manually log produced data.  But once I get stuff moved from one bunk of the V-Berth to the other I can get into my 'Electronics' stash and pull out a spare USB<--> RS-232 converter I will enable the data logging in the TriStar controller.  Till then will just enjoy the abundance of Amps (we heated our Shower Water this morning using the Electric water heater!)


Thursday, May 24, 2012

We have Solar!


Yesterday we picked up two 240w solar panels and the controller. Had the mounting hardware and wire all ready, so it was a relatively easy task of bolting on the panels last night and finishing hooking up the wire this afternoon. Early results: Impressive. We have 480w of solar panels, and right off the bat it was dumping 25.5A into the batteries. At the then 13.95v that comes to 355w delivered! Remember, this is May - and these panels are not oriented for optimal production - instead they are laying flat.

I still need to connect a computer to the controller so we can set up the data-logging capability. But once have that done will be able to log (and report) in great detail the energy production of these two panels up here in the PNW!

Kristi was busy taking photos,
These things are BIG - 65" x 38"

Everyone on the dock was lending a hand.

Here they are, all in place


Amps increased as we got closer to Noon!


Details of the system:
    2x  REC-240 Solar Panels @ $394 ea = $788
    Morningstar 45 MPPT controller         @ $425
    Mounting Hardware and Wire:             @ $619
====================================
   Total System Cost:                               $1,832
   Less 30% Fed Credit                              $550
   Final Cost                                            $1,282

As always, the Small Stuff adds up. Hardware and Wire being a significant cost. But the big ticket items are the panels.

As mentioned in a prior post one can source these for around $1/watt - however you will need to add in shipping. Expect $250-300 for shipping a panel or two - it is the size that counts. I contacted a local solar company: http://www.rainshadowsolar.com/ They were more than happy to add two additional panels to a large order they were placing, and gave me a fair price on the Morningstar controller as well. I figure I paid about the same as mail ordering these, plus I got to support a local business!

One hint: When you order panels, make sure to also order jumper wires. There are a few different 'connectors' used on Solar panels and you need to make sure you get the correct ones on your pigtails.

With the 30% federal tax credit, and the rather high cost of generating energy using our small Kubota generator, I figure we will get an ROI in about a year and a half. Will know more after we get some actual data to look at.

But for now, I am very happy! (Plus, I am surprised how well the panels blend into Viking Star. Walking around, they really are not that offensive in their looks)

The view from afar

To see more about these, including performance - click on the Solar label on the right.

Saturday, May 12, 2012

Going Solar

When we publish May's Cost to Cruise it will be a budget buster for sure as we will have two rather large costs:  300 or so gallons of fuel and now two large solar panels with an associated MPPT controller to include.

Yes, Viking Star is going Green!

As mentioned in a prior post(here http://looking-at-solar-again ) I have been watching the costs of Solar panels drop like a rock the past few years.  And they hit rock bottom late last year -  bringing the ROI on a system to under 2 years. (Side note:  Panels are now commonly available for under a $1/watt!!!)

Yesterday we placed an order through a local solar installer (Rainshadow Solar) for two REC-240 panels and a Morningstar 45 MPPT controller.  They should be in in a couple of weeks.  As Rainshadow let me 'piggy back' onto another (much larger) order we will not have to pay special shipping for these two panels.  Just pull Viking Star up to Deer Harbor dock and they will toss them aboard!

Am a bit excited about these as modeling indicates we will be able to get a very large % of our electricity use from these two panels, maybe even 100% at their peak - but more likely 60-70% of daily needs.  And that will be fine.   Combining these panels with motoring every few days we should be rolling in the Amps!.

And even better, the MorningStar controller has data logging capability - so I will be able to record (and publish) the ACTUAL output over a long period of time.  Ah, REAL DATA - Not just the 'It does all I need', or 'Batteries are full by 11am', or 'I have no idea' type answers I have gotten from asking around.

Solar, combined with a promise of the shift out of the cold/wet weather pattern this summer should = very little generator time.  Bring it on!

Saturday, November 12, 2011

Looking at Solar - - again

I have looked into Solar several times over the past 8-10 years while refitting Viking Star; it after all does seem an obvious solution for covering electrical needs.  And there are examples of cruising boats who cover most, if not all, of their electrical needs using only Solar.  Or more correctly, a combination of Solar and aggressive energy reductions: Chiefly the refrigerator.  By using high levels of insulation and efficient compressors, one is able to cut in half, or less, the electricity we use for our standard 120v  unit.

When I looked into Solar, it was to augment the recharging capabilities of the 2nd alternator (below).  We do have the Kubota DC generator – and the idea was to reduce, or eliminate the need to run this while at extensive anchoring periods.

The 1st time I looked at Solar was about 8 years ago.  Penciling things out the ROI came in around 12-15 years.  This was based on purchase price of a couple of 135W panels vs. operating cost for the Kubota.  True a more ’correct’ approach would amortize the Kubota purchase price as well, but the fact is:  Solar would not 100% cover our needs so no matter what I was going to have to install the generator.  (Plus, we need it for the Water maker).

About 2 years ago I looked again and the ROI at that time (using 180w panels) was around 5-7 years.

This summer, one more time:  3 years or less.  WOW!

Prices for Solar panels have dropped LIKE A ROCK, and continue to.  This summer one could find panels for around $2/watt, last week those same panels are in the $1.85/watt range, and I am told they will continue to decline into next year.  So, what about Solar on Viking Star?

One of the best pieces of advice for Cruisers is:  Don’t get too caught up in planning for your needed ‘stuff’ on the boat;  get out there for a while and let that tell you what your needs truly are!  This summer we typically used 250Ah per day, with as much as 380Ah / day.   And yes, this is higher than when we were doing week long cruises (Looking back at prior blog posts).  The range depended on how much we used the computers / TV and was highest when we used the Hurricane hydronic heater.  Of the 250Ah/day ‘base line’  I would say 80% is from the refrigerator and freezer.  If we say 300Ah / day average, then we have about 2.5 days of battery, being very nice to them.  (

Truth is:  We could easily go three days without unduly stressing the batteries - but then we would need to run the Generator 8+ hours to recharge them!  We have found it best to instead run the Kubota 2 hrs a day if we know we will be at anchor more than a couple of days. 

Another big draw is when we do laundry.  We either run the generator, or do it while underway.

What would a Solar system do for us?

Every time I see a boat (almost exclusively a sail boat) with Solar Panels, I have been asking them how it was working for them.  Without exception they have all responded ‘Great!’  However when I try and get details on their experiences (e.g. how many AH/day do you get) it tends to all fall into ‘I am not sure’.  Often they will say ‘everything I need’ with no real idea what their daily draws are, or ‘I get back 100Ah by 11am’ from one person with a 225w panel.   (Not sure I totally believe that last one, see below)

Well, this question of what to expect from Solar is not a new one, so I spent a bit of time researching it on the web.  There is a concept of “Solar Hours” in the industry which allows for estimation of daily production.  It is a figure of how many hours a Normalized Sun shines in a given area taking into account the latitude and typical cloud cover over a period of time.  Taking a regions Solar Hour and multiplying it by the capacity of a panel will give an estimate of the panel's output over a 24 hour period.

In the PNW we have 3.5h as a yearly average.  And I was lucky enough to have http://www.cenergysolutions.org/ send me actual date from an installation they did at Sakai School.  Mapping the capacity of the system to 3 years of actual output provides the following Solar Hours / month:

   Jan         0.9
   Feb        2.2
   Mar        2.9
   Apr        3.9
   May       4.8
   Jun         4.7
   Jul          5.0 
   Aug        4.8
   Sep        3.9
   Oct         2.5
   Nov        1.2
   Dec        1.4       Average:  3.2


During the ‘Peak Cruising Months’ (April-Oct) the average is 4.2

Using a couple of 240W panels, this would model around 2,000 watts / day, or around 150Ah / day (assuming 13.3 charge voltage).  As the panels would be placed horizontal as opposed to pointed towards the Sun, we need to reduce our estimate.  For the PNW during 'cruising' months we get about 70% efficiency of flat vs. pointed panels.  So our 150Ah gets trimmed down to 105Ah

As to costs this system could be purchased for under $1500, (less if one factors in a 30% energy tax credit).

Where does this leave us?  It costs about $1.25  for every 100Ah produced by the Kubota.  Producing 105Ah / day would ‘save’ perhaps  of $1.30 / day, and perhaps reduce the need to run the generator unless we are at anchor more than 5 days, and/or do laundry / make water.    Pure ROI seems to be now at 700 days, under 3 years worth of cruising.

So, Solar have come a long ways, and a very long ways in the past few years.

What are the downsides?   There are 2.

1st:  Shipping.  The shipping costs for these panels can be as much as a panel itself, and is not factored in above.  One cruiser I ran into solved this problem by basically pestering a local installer for many months until they finally agreed to order one extra panel for him.  I think going forward there might be such opportunities, but if not, then add perhaps $500 to the above costs.

2nd:  Size:  Costs have come WAY DOWN, due largely it appears to me by standardization around fixed installations.  And it seems the industry has settled on a more or less ‘standard’ size of 40” x 65”.   Today’s panels typically produce 225 – 270w.  If one selects a smaller panel away from this ‘standard’ size, not only is the output reduced, but the costs quickly gets back over $3/watt, and approaches $4/watt.   At one time I had thought of building an arch over the upper helm station to hold a couple of panels and also some type of soft sun cover.  Well, if we installed two panels as outlined above we would have in effect a 4’ x 5.5’ ‘cover’ just using the panels!  We are grappling with not only the aesthetics on Viking Star, but also concern over how this would change the windage of her during rougher weather.   

Another option is installing smaller panels on the side, like a couple of 135w panels.  But then the costs increases greatly.  And to be honest it might not provide enough energy to make a noticeable reduction in generator usage.


Bottom line:  yes, Solar has arrived!  In fact, for an investment of under $2,500 (MUCH less than marine generators) we could likely cover most of our electrical needs while at anchor. (Outside of Laundry and Water Maker.  But a Honda could carry those with no issues). 

Kristi and I have some thinking to do…